
(And How to tell which is which) !
How do you know that a Bank/NBFC is doing great, good, average or terrible? – Business wise
How do we figure out which ones are ‘Good’, which ones are ‘Bad’ and which ones are ‘ugly’ ?
Simple : Track a banks’ ROA (Return on Assets) & ROE (Return on Equity)
All over the world, analysts & Investors pay extra attention to these 2 ratios because they simplify everything a bank does into simple & easy to interpret numbers.
For example, ROA tells us how efficiently the Total Assets (mostly loans) are being used i.e –
How much juice (net profit) can the bank extract out of every Rs. 100 of Total Assets.
And ROE tells us how much juice (net profit) the management is able to extract out of every Rs. 100 of Equity Investors/shareholders have put into the bank.
But, how do we use ROA & ROE to analyze a Bank ?
Well, If the banks’ ROA & ROE are above 1% minimum and 12.5% Minimum respectively in the Indian Context, it’s usually considered to be doing okay to good, depending on the business model, size of the lender etc.
If it’s in the top decile (Top 10%), even better
Anything less than 1% has the potential of being ‘bad’ to ‘ugly’ !
You get it. Right?
If a bank or nbfc crosses the 1% & 12.5% threshold, it does not mean we should automatically invest in them…
In practice, analysis of these ratios means asking questions such as :
Q. What factors will drive improvements in ROA & ROE?
Because business is best seen as a movie reel – always changing & moving, rather than say, a photograph i,e static, past or current ROA & ROE numbers are usually of lesser significance compared to where they are expected to be in the future.
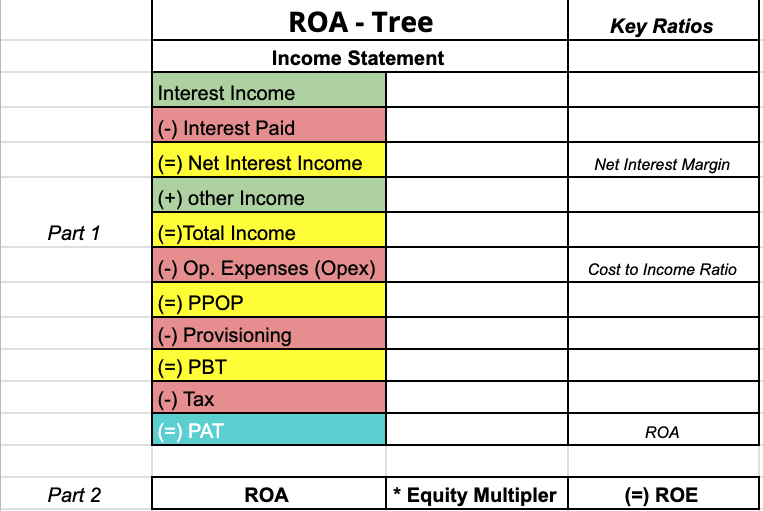
And a simple but extremely useful tool that can help investors understand potential future movements of ROA & ROE, or atleast what factors will drive changes in ROA & ROE is called the ROA – Tree
An ROA – Tree is basically a structure i.e – actually the structure of the Income Statement that helps analysts get a sense of the ‘drivers’ or ‘levers’ that can potentially improve performance.
Simply put, it’s a tool to identify what factors will drive changes in ROA & ROE
So, how does it work?
Here’s a Banks’ Income statement
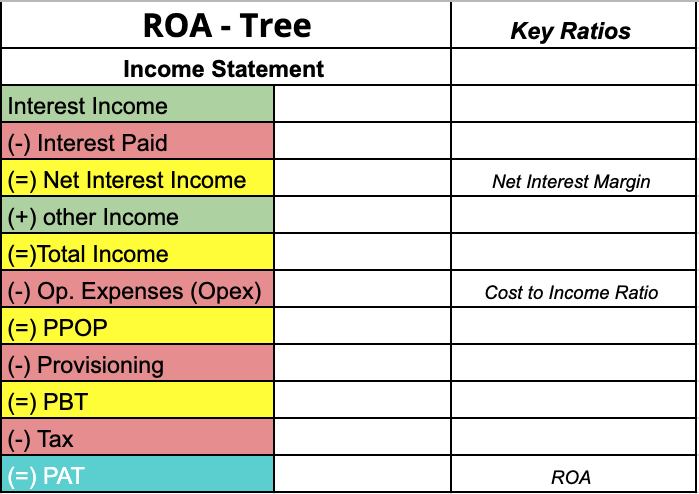
ROA Tree – Part 1
It’s obvious that all items in light green put money into the Ban/Nbfc’s accounts and therefore directly increase the profit after tax (PAT) and all in red are expenses that potentially can reduce the PAT.
We can think of items in yellow are Key checkpoints on the IS
We want the items in yellow to increase (obviously) because they lead to higher profit but usually items in yellow such as Net Interest Income and PPOP are a function of other Income and expense items.
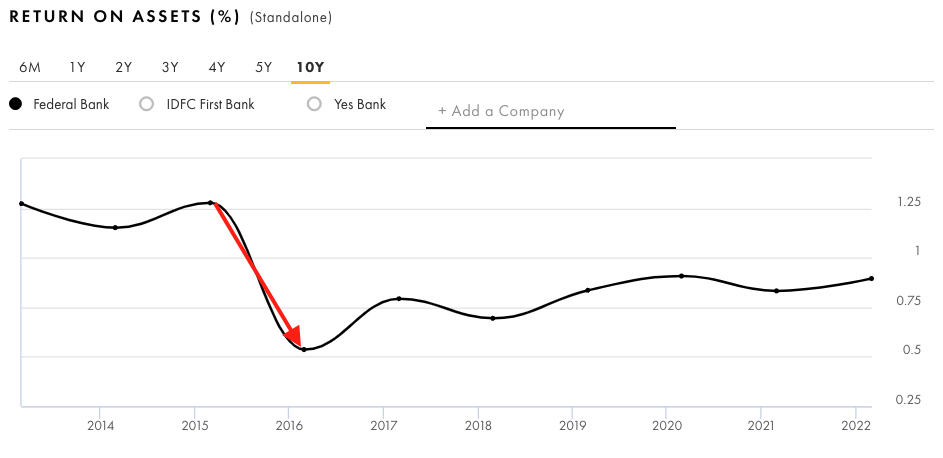
For Example, in 2016 Federal Bank was facing a unique challenge.
In the decade leading up to 2016, Federal Banks’ ROA had remained in the ~ 1-1.25% ROA zone, which was respectable but in 2016, it ran into some serious problems.
Over the last few years, a big chunk of its total loans were given to lower quality corporates to earn a higher interest rate
But these higher rates came with higher risk too and Federal Bank, just like almost every other bank that had gone gung-ho on large ticket, chunky infrastructure and project loans, ran into some serious NPA Problems.
‘Bad Money’ by Vivek Kaul (not an affiliate link), documents in beautiful detail How the Whole NPA saga unfolded (You should check it out)
Anyway, Federal Banks’ NPA issues were not very different from many other banks including ICICI, SBI & pretty much all of the Government banks.
Higher NPAs meant higher provisioning (expense) and lower PAT, lower ROA
In 2016, when Federal Bank was hit by NPA issues, its ROA practically crashed to ~ 0.5% from 1.25% just an year ago
Even Yes Banks’ failure & eventually, its rescue in 2020 was a direct consequence of this wave of infrastructure and project loans going bad.
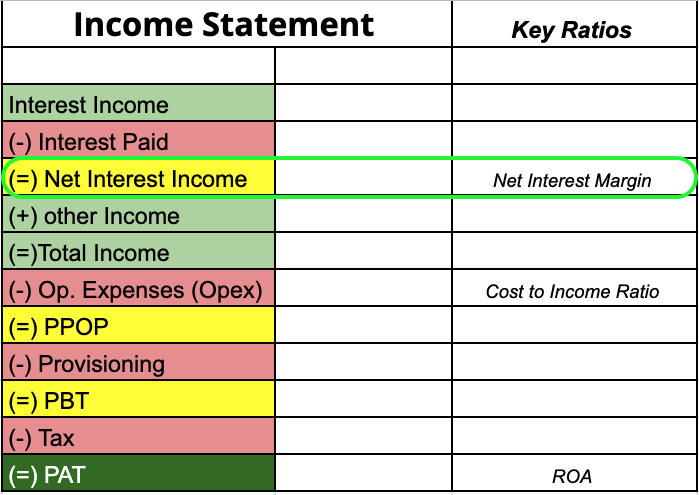
In order to improve the ROA numbers to their 1%+ glory days, the Bank had to find a way to Increase the NIM = (Interest Earned – Interest Paid) / Total Avg. Assets (1)
NIMs are like the Gross margin for Banks
And increasing NIMs usually requires increasing Int. earned or decreasing Int. paid or both simultaneously.
It decided to improve on NIMs by entering new lines of business :
- Personal loans
- Commercial vehicles
- Credit Cards (introduced in FY2021)
- Investment Banking/Capital Markets
All of which were aimed at increasing the Net Interest Margin by earning a higher interest on these types of loans or at increasing the other Income (fee income)
Why?
If we revert back to the ROA Tree, we can see the NIMs is a key driver of PAT and therefore ROA.
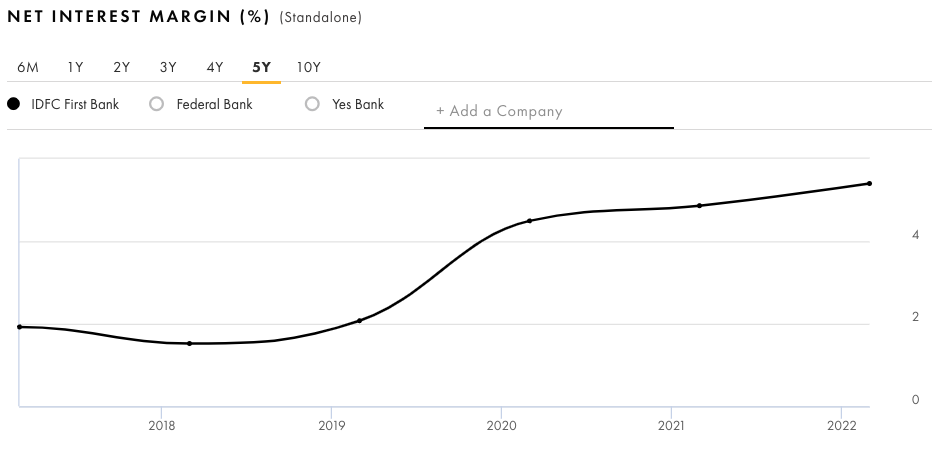
As a result of this strategy shift and executing this strategy, Federal Banks’ NIMs expanded
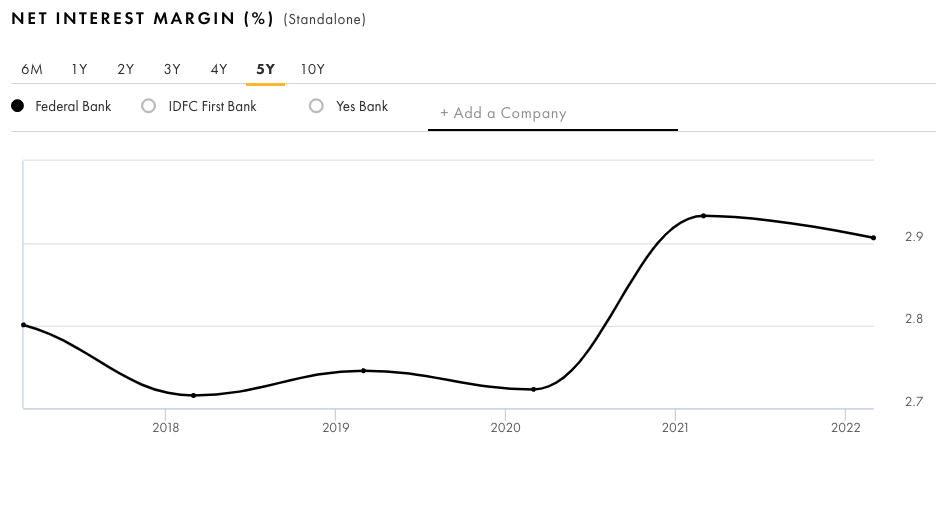
And as a direct consequence, PAT as a % of Total Avg. Assets i.e ROA has improved over the last 6 years, albeit, mostly since 2021 when the investments in the newer businesses started to show results.
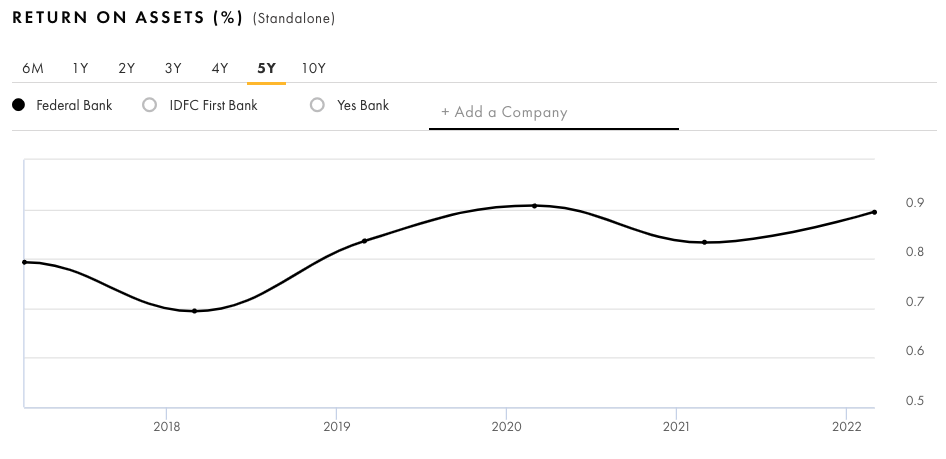
In fact, recently in Q4Fy22, ROA hit a 7 year high of 1.03%
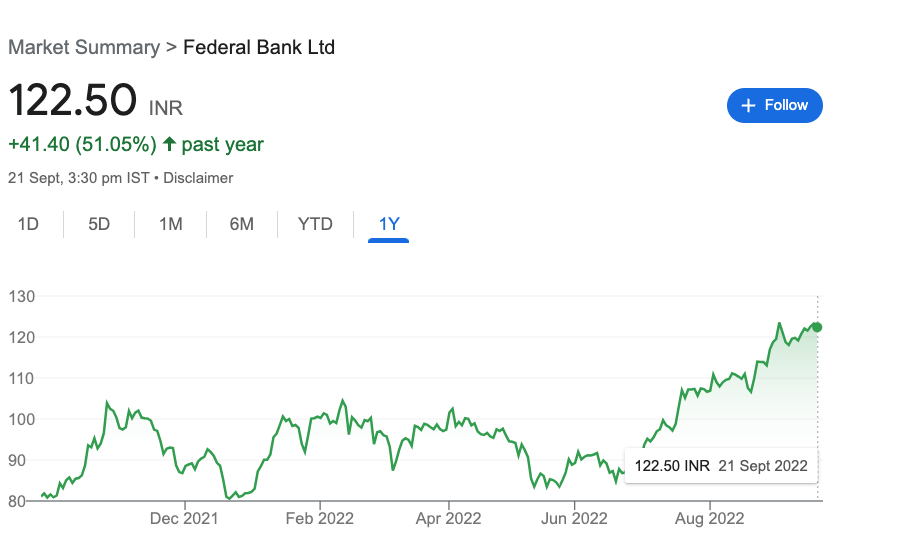
Since analysts track ROA religiously and since ‘re-rating’ in a stock is largely dependent on ‘re-rating’ i.e improvements in ROA & ROE, recent improvement in ROA & ROE was largely responsible for a 51% return over the last 1 year.
2. Cost to Income
The second key lever is Cost to Income ratio which is basically a measure of the operating efficiency of the bank/NBFC.
A declining CI ratio, all else being constant will increase ROA & ROE & vice-versa
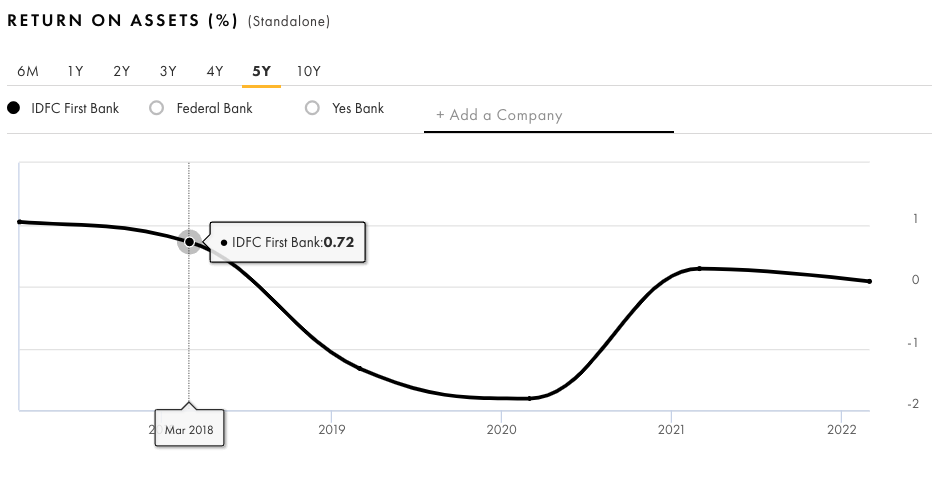
For Example, IDFC Banks’ CI ratio has increased since 2016, one of the major reasons for its sub-par ROA
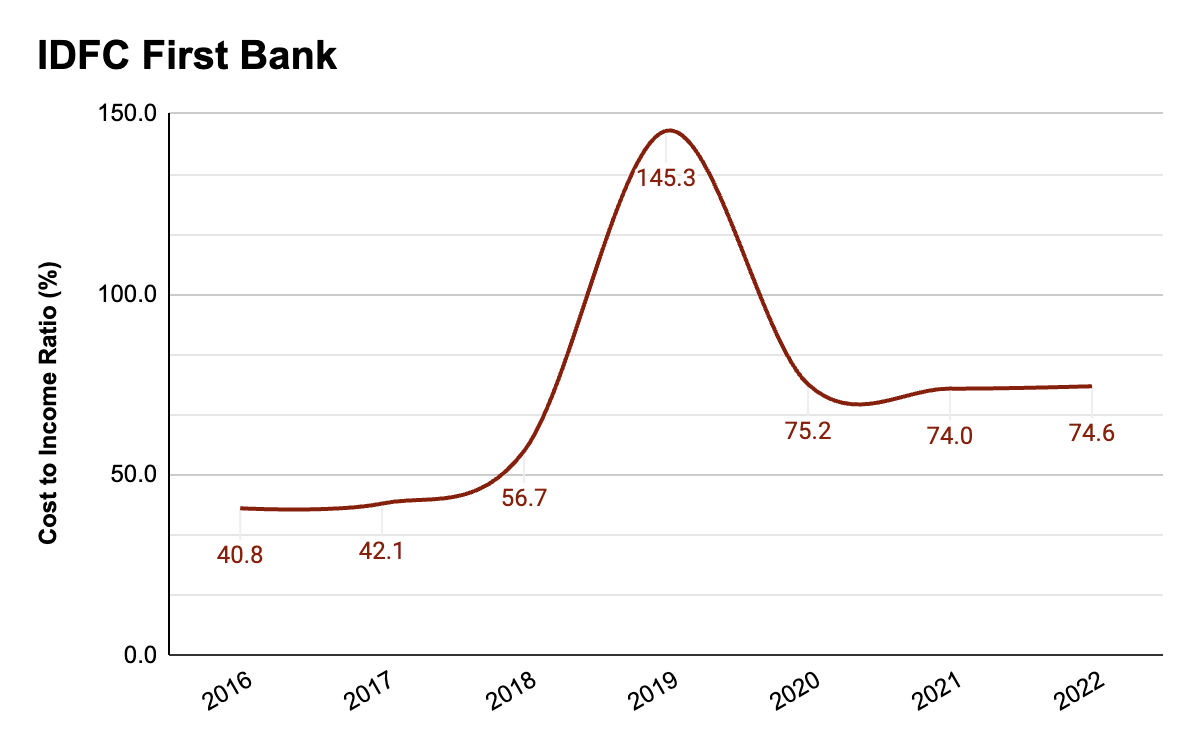
By March 2018, IDFC Bank, which was mainly an infrastructure lending bank was looking to ‘retailise’ (provide retail Loans) itself in the aftermath of the Infrastructure/Corporate loan debacle of the last decade.
So it was already investing in branch expansion (read screenshot below) and hiring by March 2018 when CI ratio had increased to 56.8%
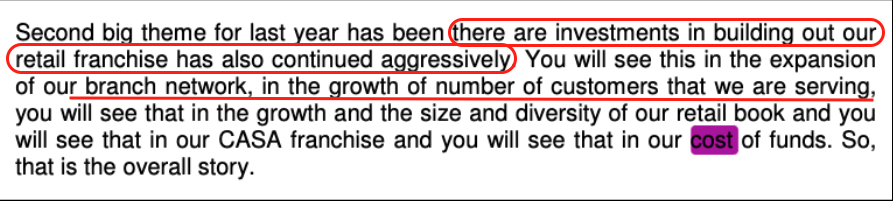
March 2018 / Con-call
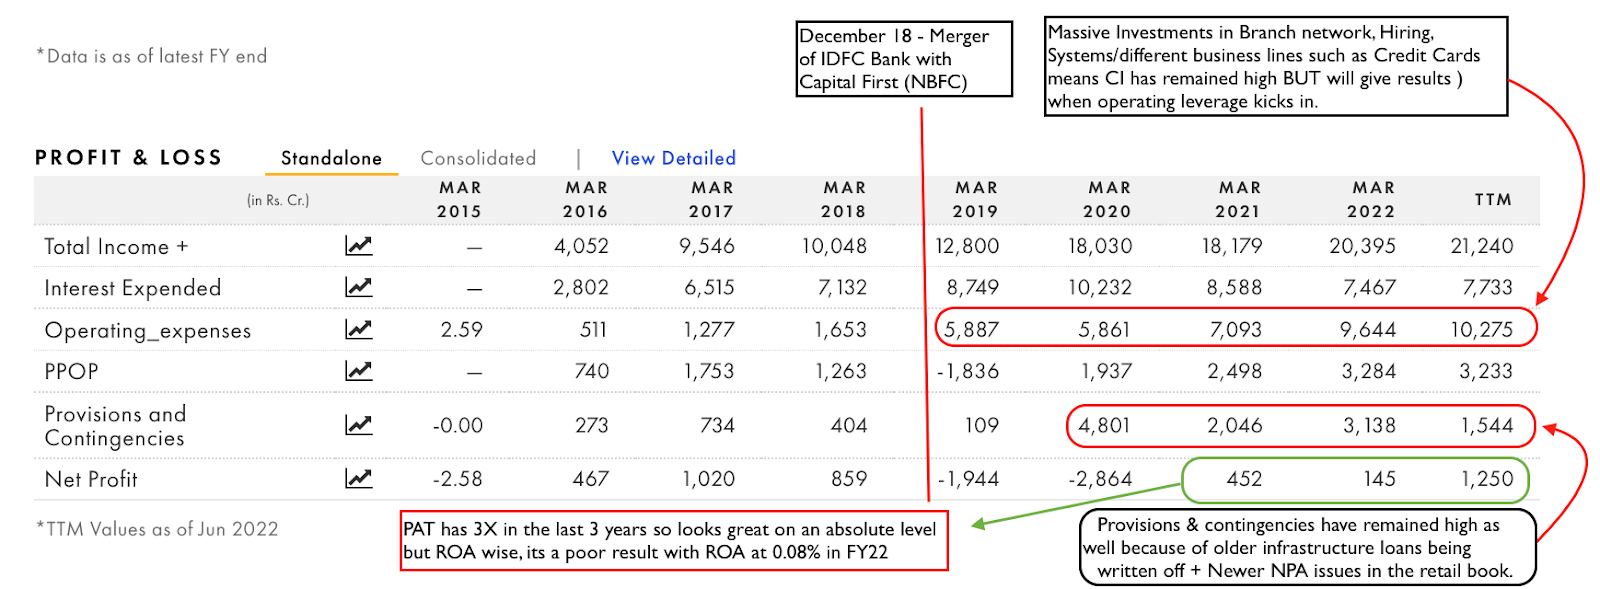
Then by March 2019, After merging with Capital First (A retail focused NBFC), IDFC Bank had become IDFC First Bank we saw an even more elevated CI ratio owing to the merger costs.
Because the whole idea behind the merger with Capital First was that IDFC Bank would slowly exit the infrastructure and corporate loans business and move towards retail loans, it was expected that CI ratio will remain high over the next few years.

March 2019 IR
Because of the large investments required to set up branches, hiring & related costs the CI ratio (along with high provisioning expense) has negatively impacted ROA numbers since the merger.
Interestingly, these investments in new branches and higher CASA sourcing (leading to lower cost of funds) and retailization of the bank has led to significant improvements in other key drivers of ROA such as :
In Summary, IDFC first is a great example of a bank where some ROA drivers are working in its favor and some not so much, with the net result being negative.
IDFC First Banks’ NIMs has improved dramatically as the customer segment it is targeting + retail loans, help the bank earn high interest rates.
Even its loan book growth has been spectacular, however, high Opex means CI ratio has remained elevated AND lastly high provisioning too has severely restrained its ROA numbers.
3. Provisioning / Asset Quality
We’ve already discussed the First two ROA drivers : NIM & CI Ratio with examples, let’s now talk about the one that is probably the most unpredictable one : Provisioning
Banks that have stable Asset Quality or NPA ratios inherently have more stable provisioning expenses.
Such banks are rewarded with higher trust which reflects in terms of higher P/Bx values.
Of course, since provisioning is an expense, higher Provisioning leads to lower profitability (all else constant) and vice-versa.
one interesting example of the kind of impact unexpected provisioning can have on a banks’ ROA is Bandhan Bank
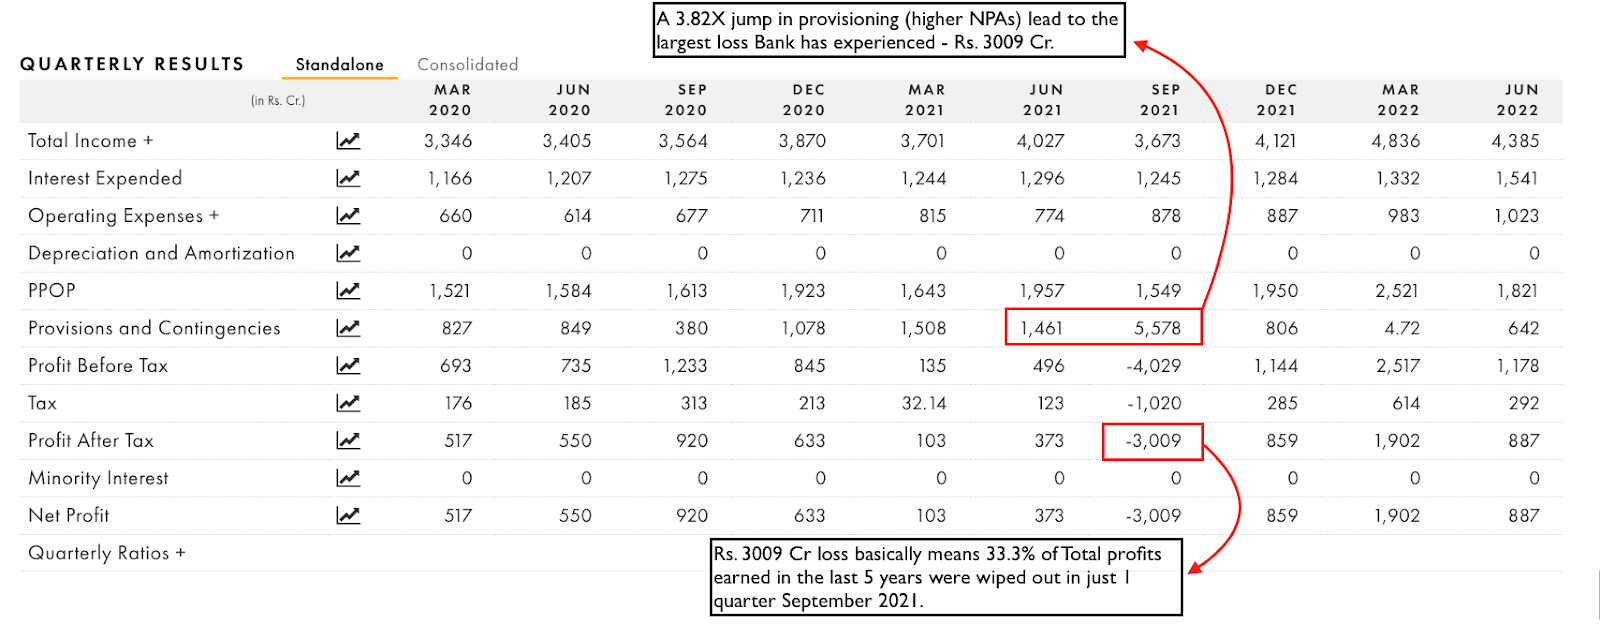
Given its relatively different business model compared to most other banks, Bandhan was already in the ‘high risk high reward’ segment of lending – Microfinance.
But following the lockdown, the bottom of the pyramid which makes up a significant part of Bandhan’s business were severely impacted leading to high NPAs and high provisioning in the september 2021 quarter.
Resulting in a severe ROA contraction.
In one quarter, Bandhan Bank made losses equalling ~ 33% of the total profits it earned over the last 5 years, totalling a staggering Rs. 3009 cr
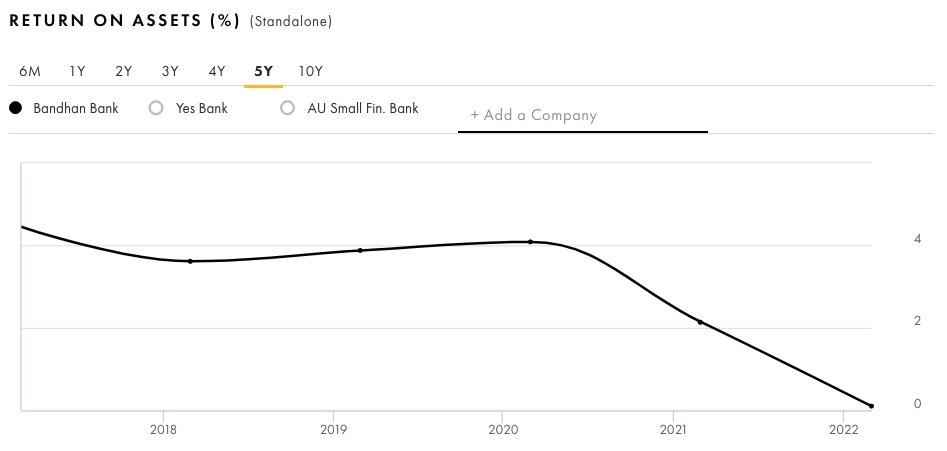
Source : www.tijorifinance.com
4. Leverage
Leverage is a measure of how much of other people’s money a bank has in the form of borrowings, CASA, Deposits etc.
Basically any other source of fund, other than equity.
Leverage = Total Assets / Equity
Leverage directly increases the ROE because ROE is simply :
ROE = ROA * Leverage
Leverage is also known as Equity Multiplier
Which brings us to the second part of the ROA Tree
If you notice, higher leverage can increase ROE, which is great but higher leverage also comes with increased risk.
So much so that usually banks/NBFCs are restricted to stay with a leverage limit.
For example, National Housing Bank, which is responsible for carrying out the housing sector related policies of the government, lends to Banks & NBFCs in the affordable housing/housing sector.
It imposes several standards on these NBFCs and usually demands that they stay within a certain leverage limit.
Higher leverage can also increase the cost of borrowings which impacts PAT & ROA to begin with
On the other hand, although, low leverage is considered conservative, it also lowers ROE
Thus, ROE & leverage must be balanced keeping the above considerations in mind
To understand things better, let’s take the example of a very small NBFC – CSL Finance Ltd.
CSL finance makes for a great example because it isolates the importance of leverage and how it impacts ROE.
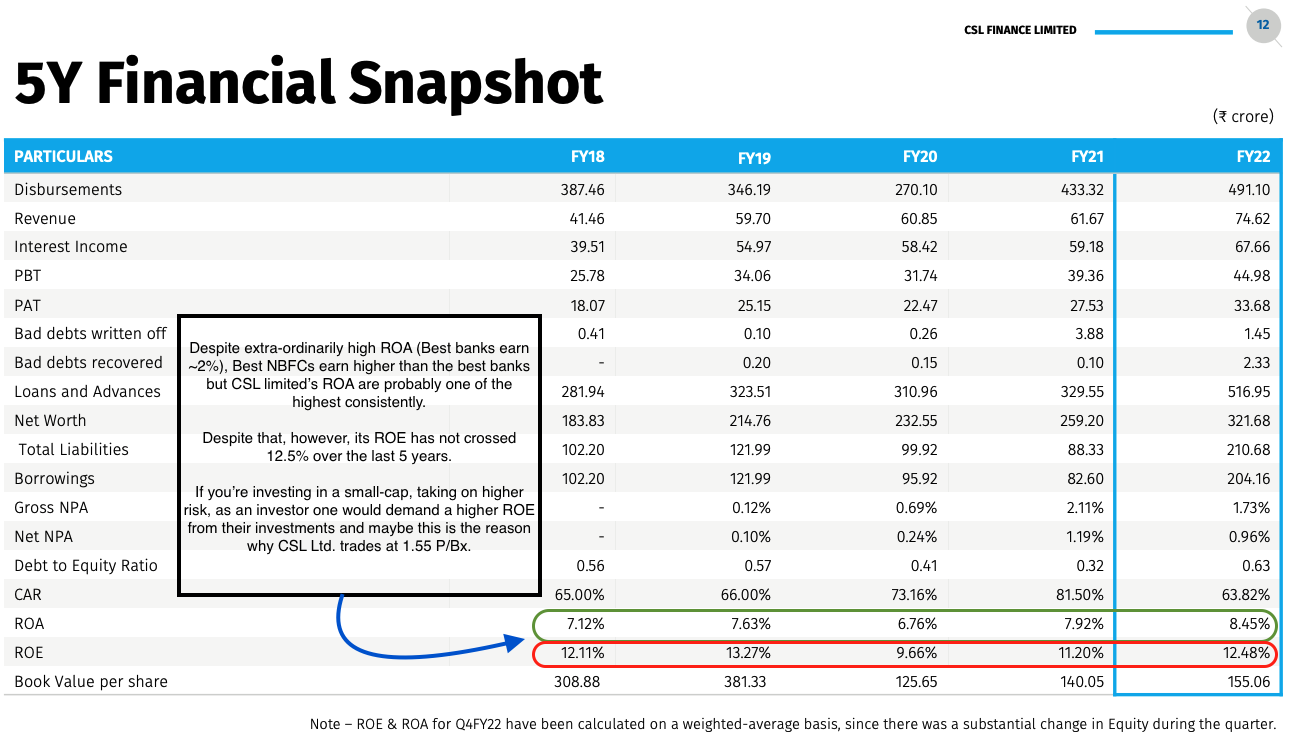
Despite a very high ROA, ROE is at best average and the reason for this is that the NBFC uses minimal leverage.
This is obviously a conservative measure but at the same time it lowers ROE.
Good thing is that the management has acknowledged investors’ concern around ROE and low leverage and is trying to increase leverage to optimal levels, to ROE above the 15% mark, an important trigger point for ‘re-rating’ in the stock.
So, In Conclusion :
We basically discussed that Banks and NBFCs, whether they are Good, bad, ugly can be best analyzed by using a simple tool called ROA-Tree.
Frankly, it is nothing more than understanding the logical flow of money all the way from Interest earned to PAT
I.e – How the Income statement works (part 1)
AND the relation between ROA & ROE, which is simply
ROE = ROA * Equity Multiplier/Leverage (part 2)
By understanding the key triggers that impact the near and long term performance of a bank/nbfc, as investors & analysts we can get a sense of what strategy the bank/nbfc is using to push the ROA & ROE up, whether those strategies are likely to bear fruit and when they are likely to work out etc.
So, ROA Tree gives tremendous amounts of insights into the functioning of a Bank/NBFC and therefore its valuations and therefore its stock price.
Did you get a good understanding of How the ROA Tree works? And will you be able to use it to analyze banks/nbfc, please let us know in the comments below.
Disclaimer :
- I am NOT a SEBI Registered Investment Advisor, but then again, this is NOT investment advice. All forms of content/communication on our website or online media accounts are strictly educational in nature.